A Simulated View of the Galaxy
My first article published in BYTE Magazine. It appeared in the April, 1979 issue, page 66.
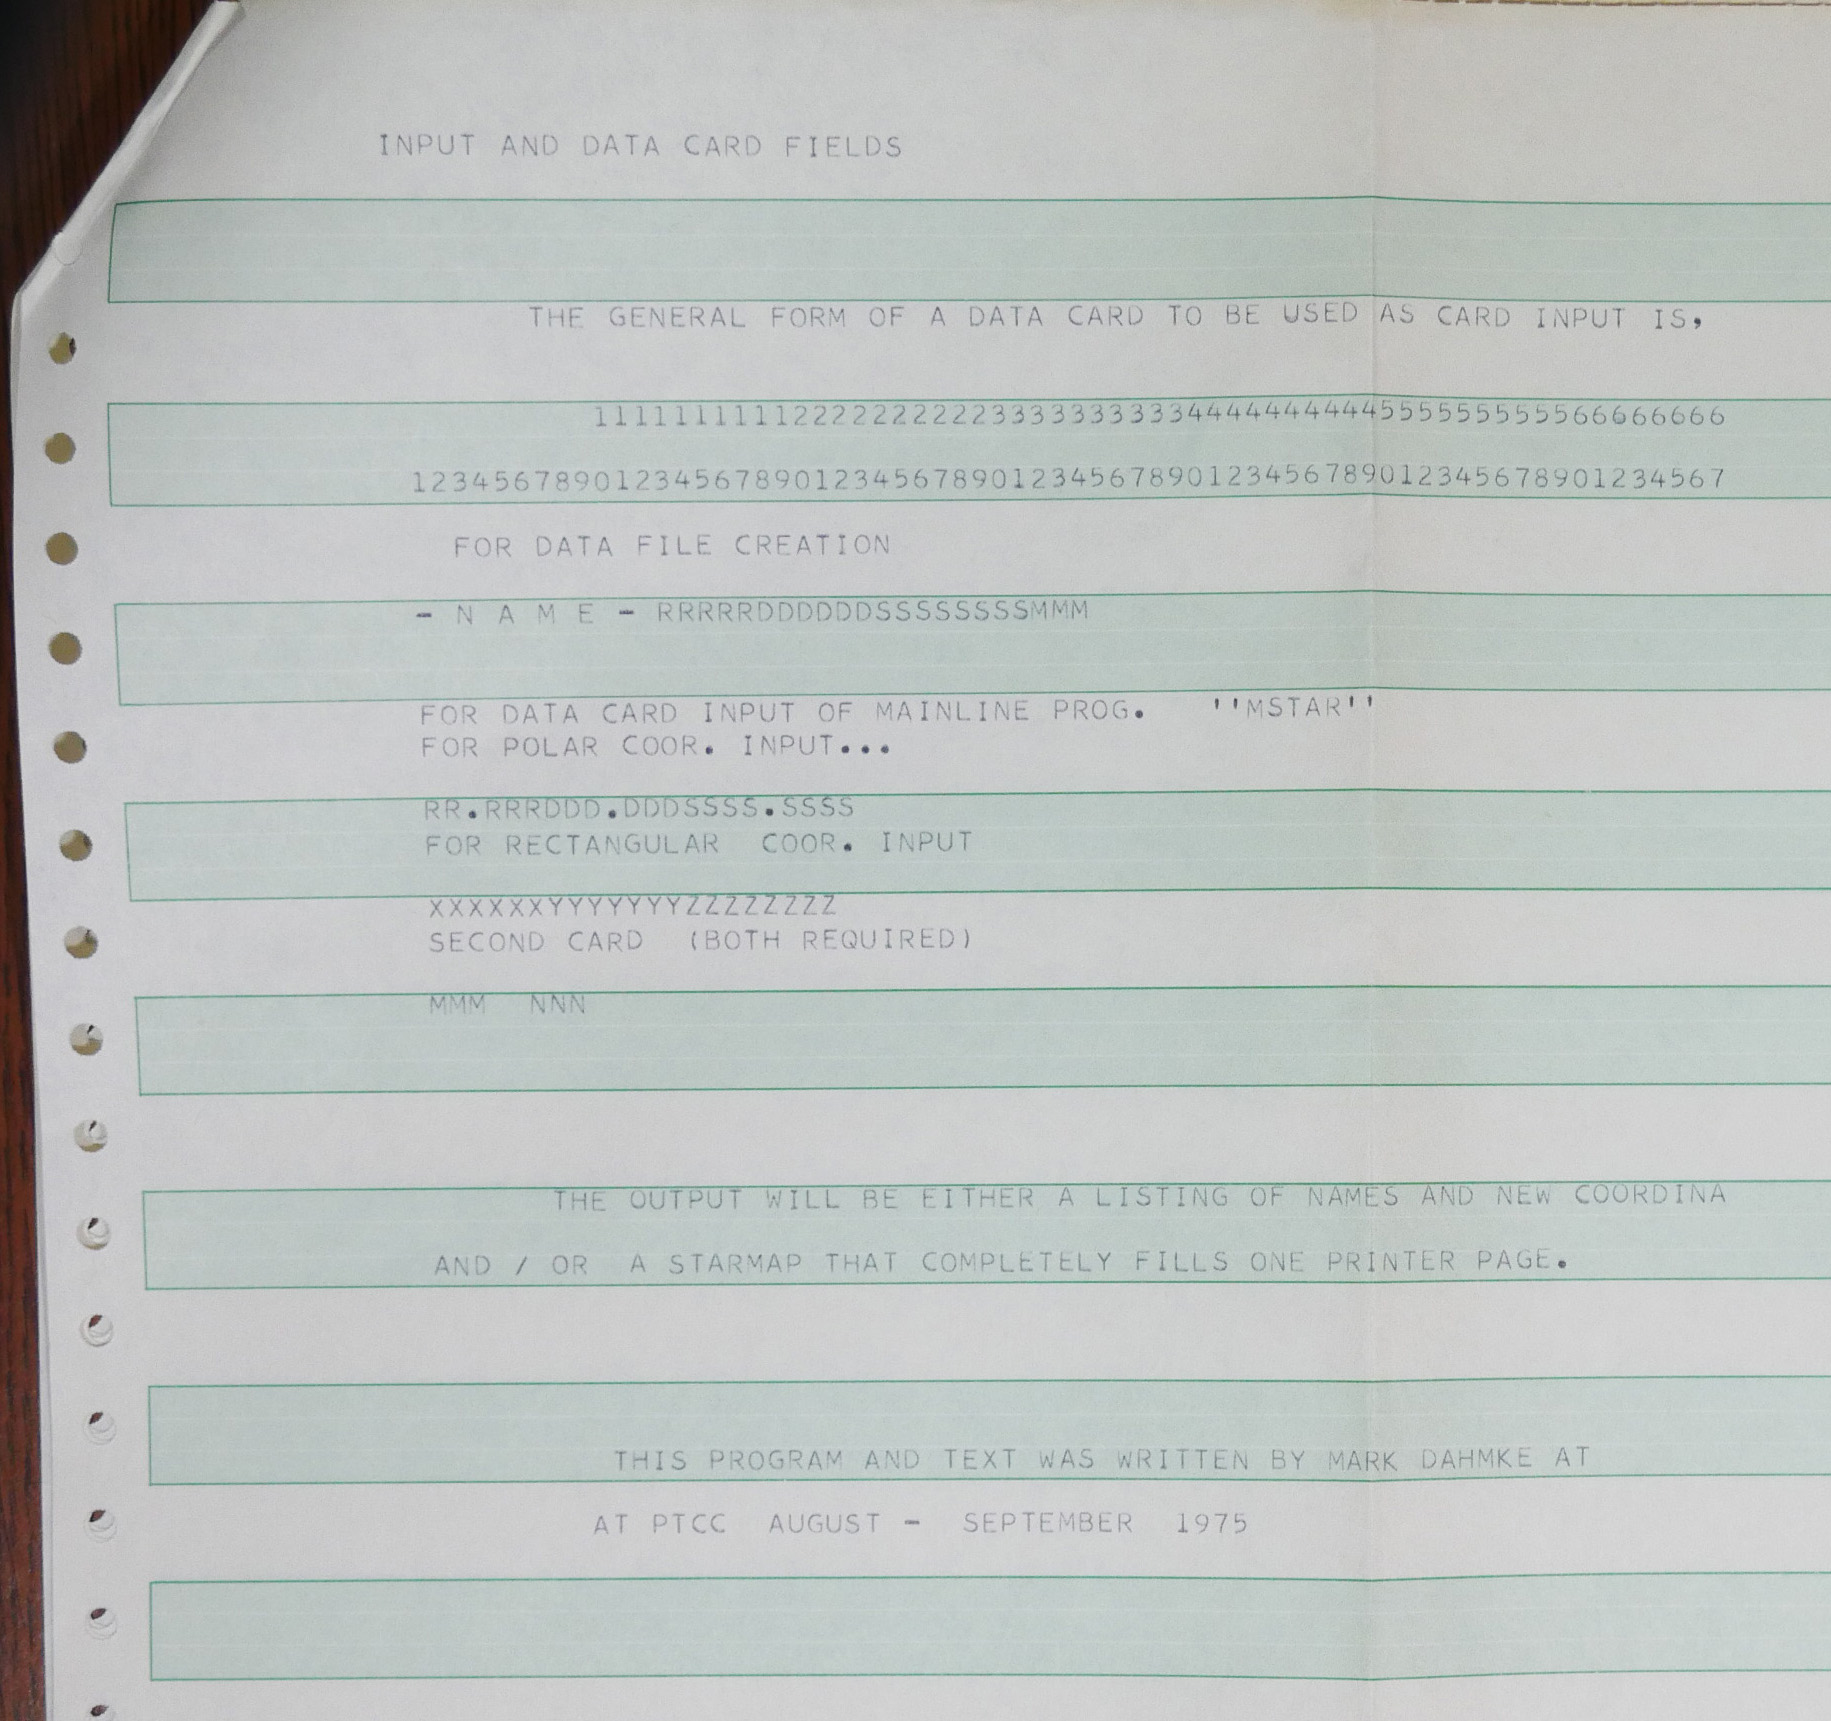
The first version of this program wasn’t even a program – I ran the calculations by hand with my HP-35 calculator, one star at a time. In 1975 I wrote a version in FORTRAN that ran on the IBM 1130 computer at Platte Technical Community College in Columbus, Nebraska (now Central Community College).
Note that this is computing in an era when mainframe computers were thousands of times slower than modern smartphones, microcomputers ran at speeds measured in thousands of instructions per second, graphics displays cost hundreds of thousands of dollars and there were only a few color displays in existence. When I ran this program on an IBM/370 using the 2250 graphics display, it used a substantial portion of the CPU (I ran it late at night) and it cost over $1 per minute to run. When I finally was able to port it to my Z80 computer, it took a few seconds to render each frame. The last time I ran it was on an Intel 386/66 as a screen saver. It was able to refresh the display about once per second with a database of 300 stars.
I discovered (only recently) that my work on stellar 3D visualization might have been a first. I have not found any other references to the development of a comparable computer generated stellar visualization that predated my Starmap program.
Although it was a bit more primitive due to available hardware, it predated the galaxy animation used in Sagan’s Cosmos series (1979-1980) and also the star field animation in Star Trek: The Wrath of Kahn (1981-1982).
See the end of this page for other code samples and images that weren’t in the BYTE article.
At one time or another, each of us lets our imagination wander; perhaps to places familiar to us, or places we have never been and can only dream about exploring. Often, my imagination leads me to the questions: “What does our sun look like from neighboring stars?” and “What do our familiar constellations look like from other points of view?” Have you ever wished that you could travel anywhere in the universe whenever you wanted to? With the help of computers and graphics displays we can begin to answer some of these questions and have fun exploring what we know about the galaxy at the same time.
Getting Started
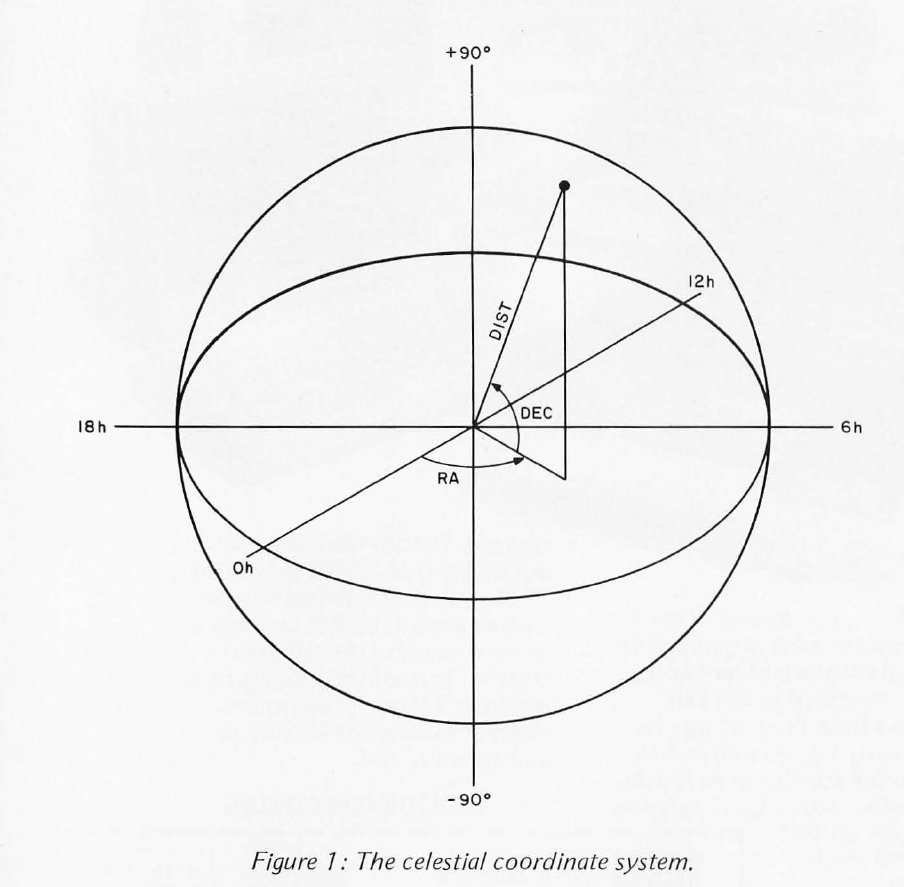
Several things are needed to simulate the stars in our galaxy; an algorithm that will allow us to shift our position with respect to the Earth based coordinate system; actual or hypothetical coordinates of stars; and a display device on which to plot the resulting star maps. The first version of this program was written four years ago and run on an IBM 1130 computer. Output was in the form of a printer plot. 50 stars were entered, using data on the 50 brightest stars in our sky. Since positions given in star catalogs are in celestial (spherical) coordinates, right ascension (R A) corresponding to longitude (0 to 23 hours), declination (DEC) corresponding to latitude (-90 to +90 degrees), and distance in light years were entered directly into a disk file. The program then performed the necessary conversions to get values in radians. Figure 1 shows the celestial coordinate system.
Coordinate Transformations
In order to display the stars as they would appear from another point in space, their coordinates must be converted to a manageable form. Shifting the origin of the coordinate system appears to be the easiest way to obtain the desired results. Declination and right ascension must be converted to radians first:
RA = RA x 0.261799
DEC = DEC x 0.01745
where RA and DEC represent right ascension and declination, respectively. Then the celestial coordinates can be converted to rectangular coordinates:
X = R x cos(DEC) x cos(RA)
Y = R x cos(DEC) x sin(RA)
Z = R x sin(DEC)
The resulting rectangular coordinates are in units of light years, because of the variable R (distance). The coordinates may be kept in three arrays for easy manipulation. Next, the origin must be shifted to the new point of view. The celestial coordinates of the destination or new origin are given by the user of the program (through console input) and converted to rectangular coordinates with the same set of equations used above. To shift the origin, the following three equations should be used:
X’ = X – X0
Y’ = Y – Y0
and Z’ = Z – Z0
where X0 , Y0 and Z0 are the rectangular coordinates of the new origin; X, Y, and Z are the old coordinates of a star in the three arrays; and X’, Y’ and Z’ are the resulting shifted coordinates. To display the stars, the rectangular coordinates must be converted back to celestial coordinates:
(R’)2 = (X’)2 + (Y’)2 + (Z’)2
RA = arctan (Y ‘/Z ‘)
DEC = arcsin (Z’ / R’).
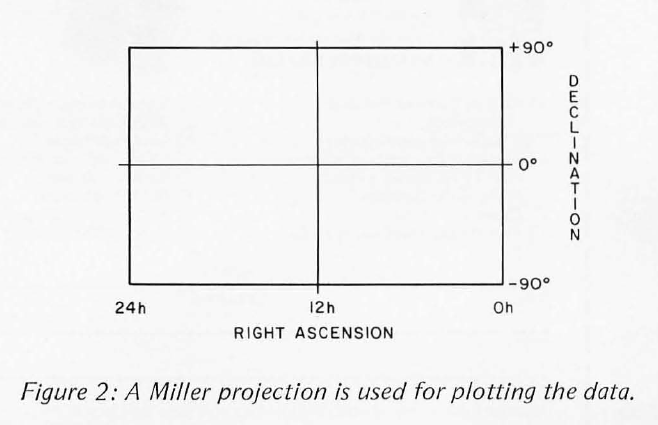
It is also necessary to multiply by the appropriate scale factors to be compatible with the screen or window dimensions of the display device. The current version of the program displays the stars in the form of a Miller projection, as shown in figure 2. This produces a distorted view on the top and bottom of the display but does show the entire sky. An alternate format magnifies the window to display only a 50 by 50 degree frame. This gives the impression of looking out the window of a spaceship, but makes navigation difficult.
In order to shift the window, we must introduce some new variables to indicate in the program which rotations are required. This can most easily be accomplished by altering the equations used for shifting the origin:
X’ = X – X0
Y’ = Y – Y0
Z’ = Z – Z0
will become:
X’ = (X – X0) (cos Φ)) (cos θ) + (Y – Y0) (sin θ) (cos Φ) + (Z – Z0) ( sin Φ)
Y’ = (Y – Y0) (cos θ) – (X – X0) (sin θ)
Z’ = (Z – Z0) (cos Φ)) – (X – X0) (cost θ) (sin Φ) – (Y – Y0) ( sin θ) (sin Φ)
where:
θ = rotation about the X axis on the Y, Z plane,
Φ = rotation about the Z axis on the X, Y plane.
Also, when converting back to celestial coordinates, scale factors must be introduced to produce a 50 by 50 degree field of view. The user may wish to experiment with other window formats.
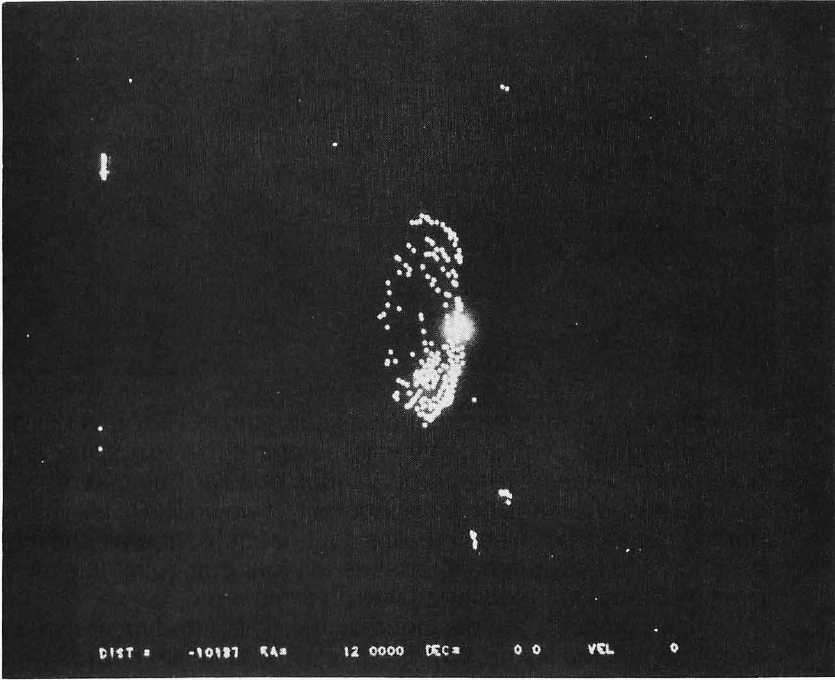
Photo 1: Side view of our galaxy from 90,987 light years.

Table 1: Execution times of one iteration of the program with various numbers of stars. Times include plot or display device data transfer rates.
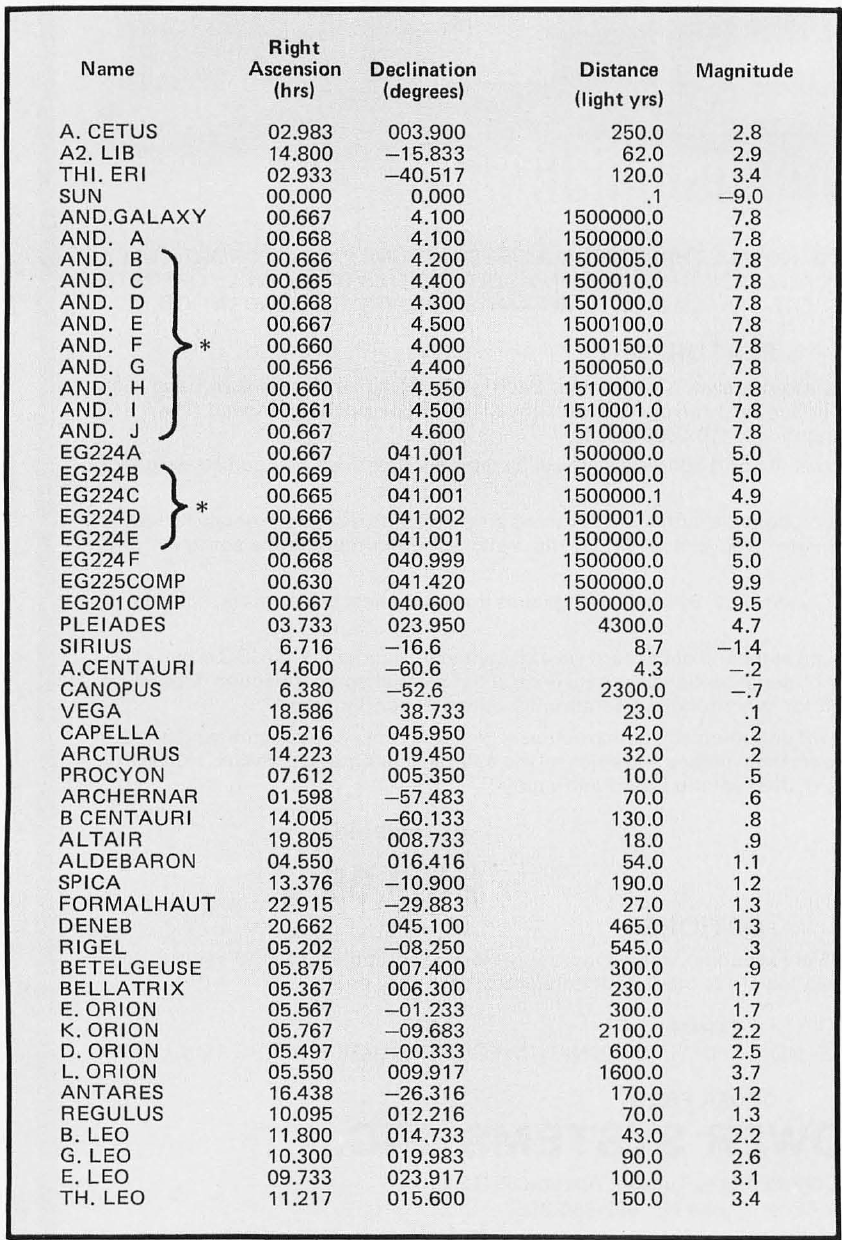
Table 2: Star coordinates (partial listing) taken from star atlases and catalogues. Besides using real stars, the author also input 300 “imitation” stars to fill out the galaxy to what it actually looks like. The stars listed should be enough to produce interesting patterns in a reasonable amount of home computer time. Names (popular or scientific) are rough approximations in English alphabet. An asterisk represents ficticious ‘fill-out” stars to represent extragalactic objects.
Expanding the Model
Looking at the sky from various points of view in space is interesting, but I have found that animation really shows the power of the simulation technique, and of animated graphics. With the coordinates of over 400 stars (100 real stars and 300 that add the general shape of the Milky Way spiral arms of our own galaxy), we can begin the exploration of our universe. Unfortunately, 400 stars do not make a galaxy, or even a small fraction of it, but with a little imagination (which was all we had in the first place) we can mentally fill the gaps in the model. The current version of the simulation runs on an IBM 370-158 with a 2250 graphics display unit. The 2250 has a resolution of 4096 by 4096 points. With a slight modification to the program, it will run in a continuous loop, starting with a direction vector and velocity in light years per iteration. The effect is that of a space craft with almost unlimited velocity. With a fast processor, the impression of speed is dramatic. Velocities of 10,000 light years per second have been simulated. There are no relativistic effects, but it might be interesting to add the necessary equations—especially if color graphics are available. The Doppler shifts would be most striking. The stars in the direction of travel would be intensely blue, while those receding from the observer would be a deep red.
Adding More Stars
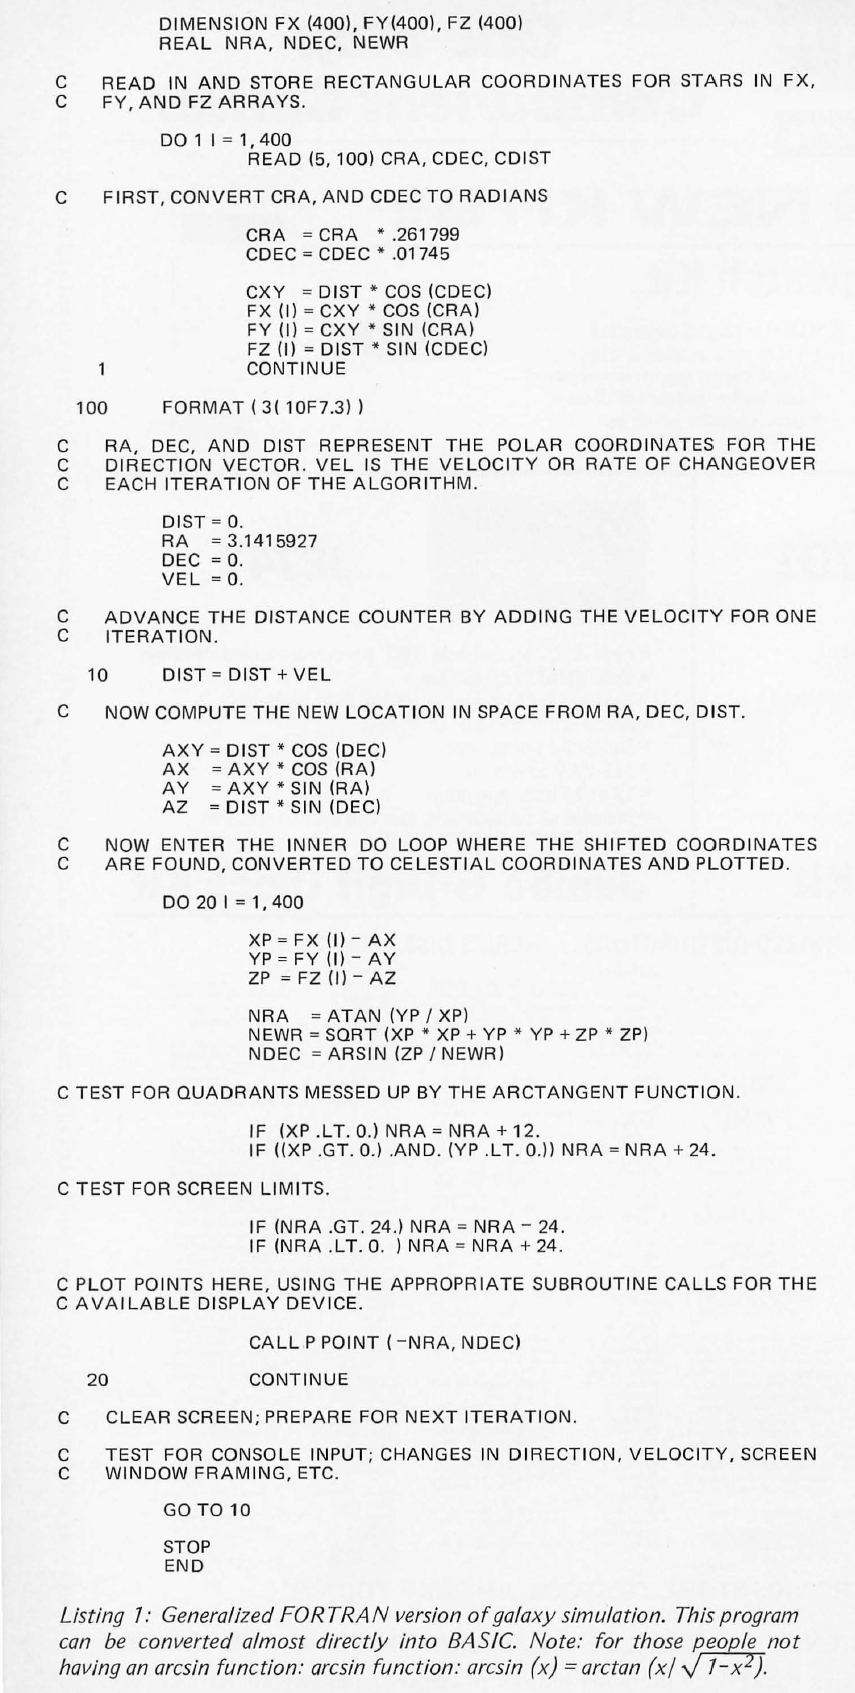
As my desire to travel outward increased, I soon realized that I would have to have something to travel to. Additions to the model included the Andromeda galaxy (approximately 1.5 million light years away), the Magellanic clouds (our nearest intergalactic neighbors) and several other extragalactic objects. One problem with adding more stars is that the execution time goes up proportionately. When experimenting with computer based simulations, this soon becomes apparent. Note that in listing 1, the algorithms have been optimized to the extreme, to cut down on the execution time. Comparison tests were run on several systems with the results shown in table l. The IBM-1130 was slowed down by its printer, used to generate a printer plot of the star map. The 8080 is almost fast enough to compete with the 370, if it didn’t have to do the floating point calculations in software. A floating point hardware board would probably decrease the times given for the 8080 by a factor of 10. The 370 is a multiprogramming system—running several other programs at the same time. Thus, the simulation has to compete with other programs and is also slowed down by competition for peripheral devices such as video terminals, the 2250 graphics display, printers, and card readers.
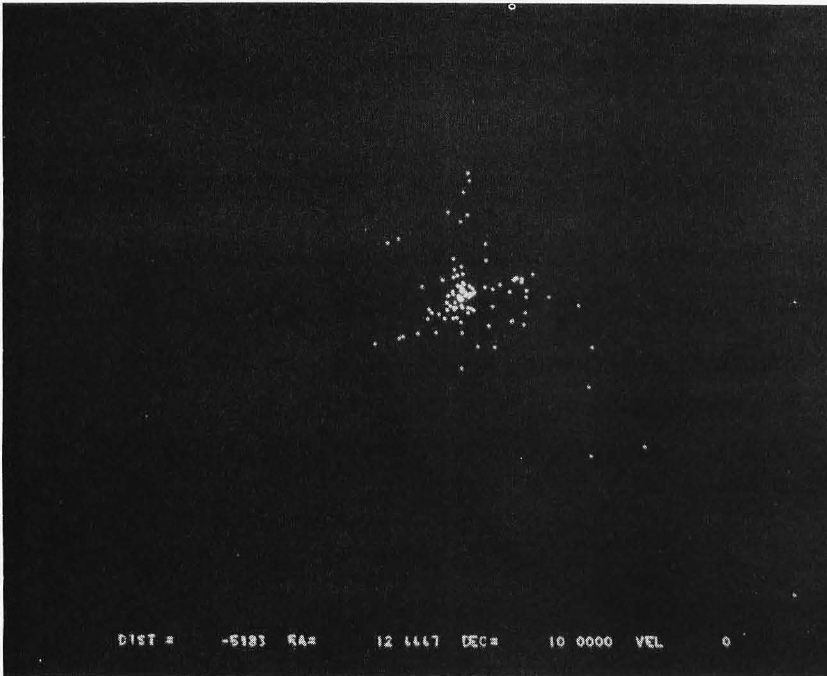
Photo 2: Our celestial neighborhood from 5983 light years
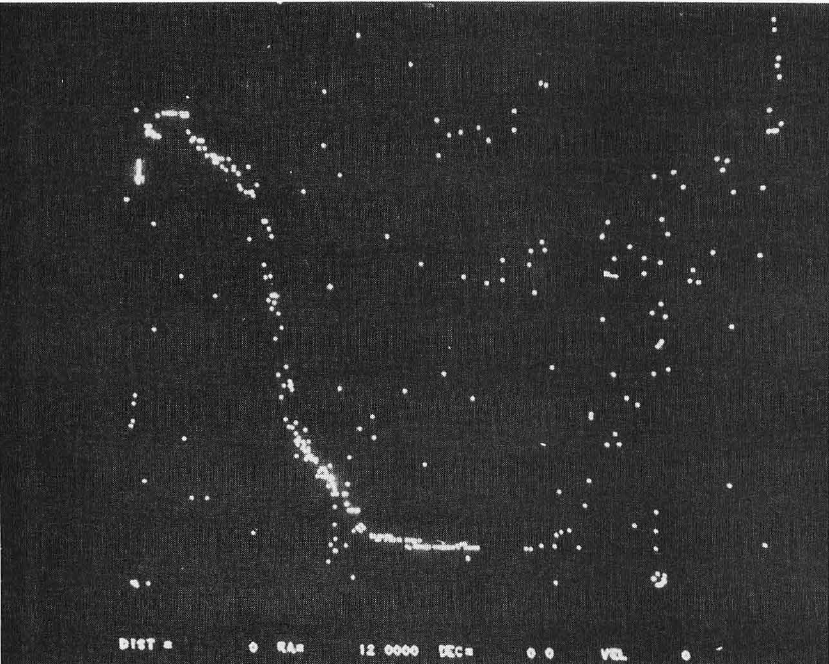
Photo 3: A Miller Projection of the sky as seen from Earth. Note the Big dipper in the upper center, Leo just above and right of center and the Milky Way curving down from upper left to bottom center.
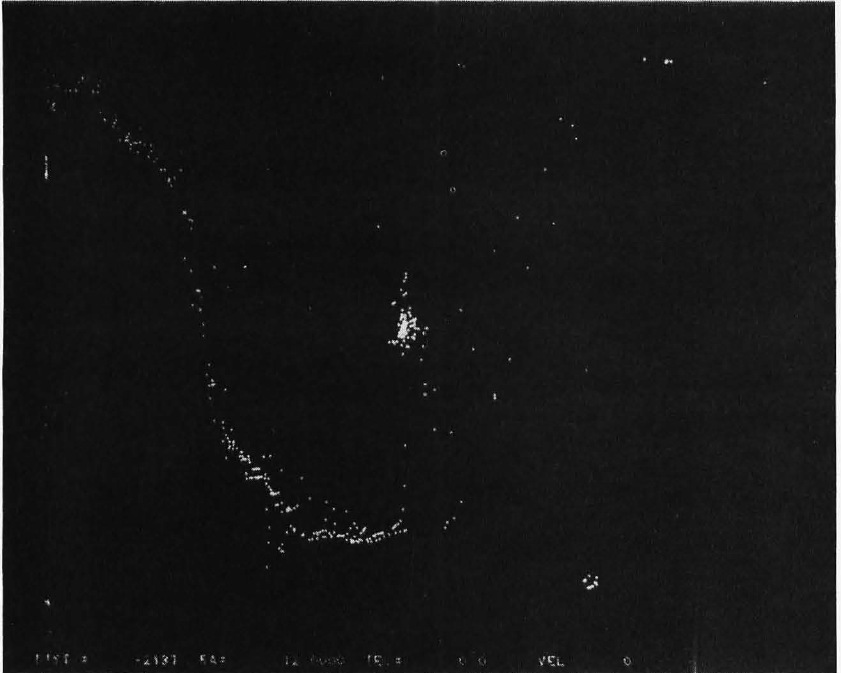
Photo 4: The local constellations from 2937 light years against the background of the Milky Way.
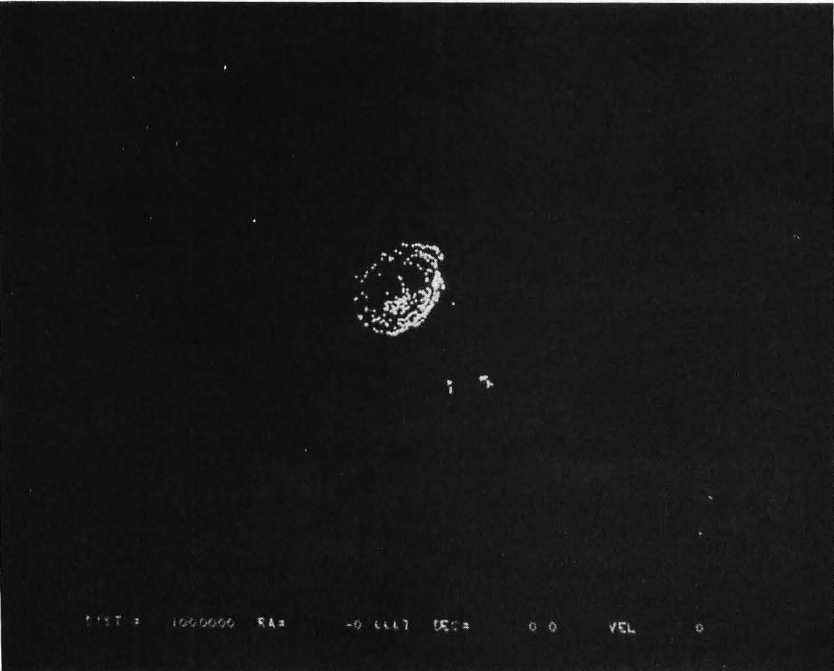
Photo 5: Another side view of the Milky Way galaxy from 1 million light years. The two small objects just below and to the right of the galaxy are the large and small Magellanic Clouds.
Implementation
The details of implementation depend on the computer, display device, and language used. The original IBM-1130 version used a printer plot because that was the only output device availabe. Ince t e avala e memory was limited (8 K words), the program was written to make heavy use of disk files for storage of the starting coordinates and intermediate results. The last phase of the program scanned the disk file containing the shifted coordinates and produced a printer plot.
The second version ran on an IBM/360-65 and plotted on a Tektronix 4013 graphics display terminal. Although neither of these first two versions was animated, single star maps could be obtained. The 2250 version required considerably more programming effort. Since the 2250 is a high speed device, true animation was finally possible. The 2250 refreshes its display from a core buffer loaded from the processor. Coordinates are plotted and mapped into the buffer; subroutine EXEC is then called and the entire buffer is sent to the display. Unfortunately the buffer must be cleared before another iteration can take place—but clearing the buffer also clears the screen. The solution is to maintain two separate buffers. One can be displayed on the screen while the other is being cleared and loaded. If this is not done, the display will flicker with a duty cycle of about 10 percent on, 90 percent off, since the calculation time is greater than the intermediate display time.
Sample Output
Photo 1 is a side view of our galaxy from 90,987 light years. As you can see, the model is not accurate because the middle of the galaxy is almost empty. Also, the large bright spot on the right side of the galaxy represents the tight group of 100 stars that form our local constellations. At the bottom of the screen distance, right ascension, declination, and velocity have been displayed for reference. The minus sign on the distance means that the direction of travel is opposite the direction the right ascension/declination vector. Photo 2 is a view of our galaxy from -5983 light years. Photo 3 shows the sky from Earth (note the Big Dipper in the upper center, Leo just above and right of center, and the Milky Way down the left side and across the bottom). Photo 4 shows our local constellations from 2937 light years, against the background of the Milky Way. Photo 5 is another side view of the Milky Way from one million light years (viewed with the 50 by 50 degree window). The two small objects just below and to the right of the galaxy are the large and small Magellanic Clouds. They are approximately 100,000 light years from the Milky Way.
Other Possibilities
Computer enthusiasts who are also interested in astronomy or physics might want to experiment with the Doppler shift effect mentioned earlier—requiring a color graphics display. Also, giving the stars colors related to their surface temperatures might be interesting. Another possibility would be the addition of magnitude (brightness). The IBM-1130 version calculated magnitudes and used different printer chartacters to indicate stars, but the 2250 does-mot have a programmable intensity control.
Another interesting possibility lies in the three-dimensional nature of the model. If two images were plotted side by side on the screen at slightly different viewing angles, a pair of stereoscopic viewing glasses would permit a truly three-dimensional view. I have experimented with the stereo three-dimensional effect by placing similar Gould hard copy plots side by side. The sense of depth produced gives one a feeling of vertigo.
Since the model is animated, navigation experiments are possible. Perhaps the algorithms presented here could be written into a game program producing the ultimate celestial exploration game.
Additional content that was not in the published article
The following two printouts show portions of the code from two versions of the program that ran on an IBM/370 with the 2250 vector graphics display.
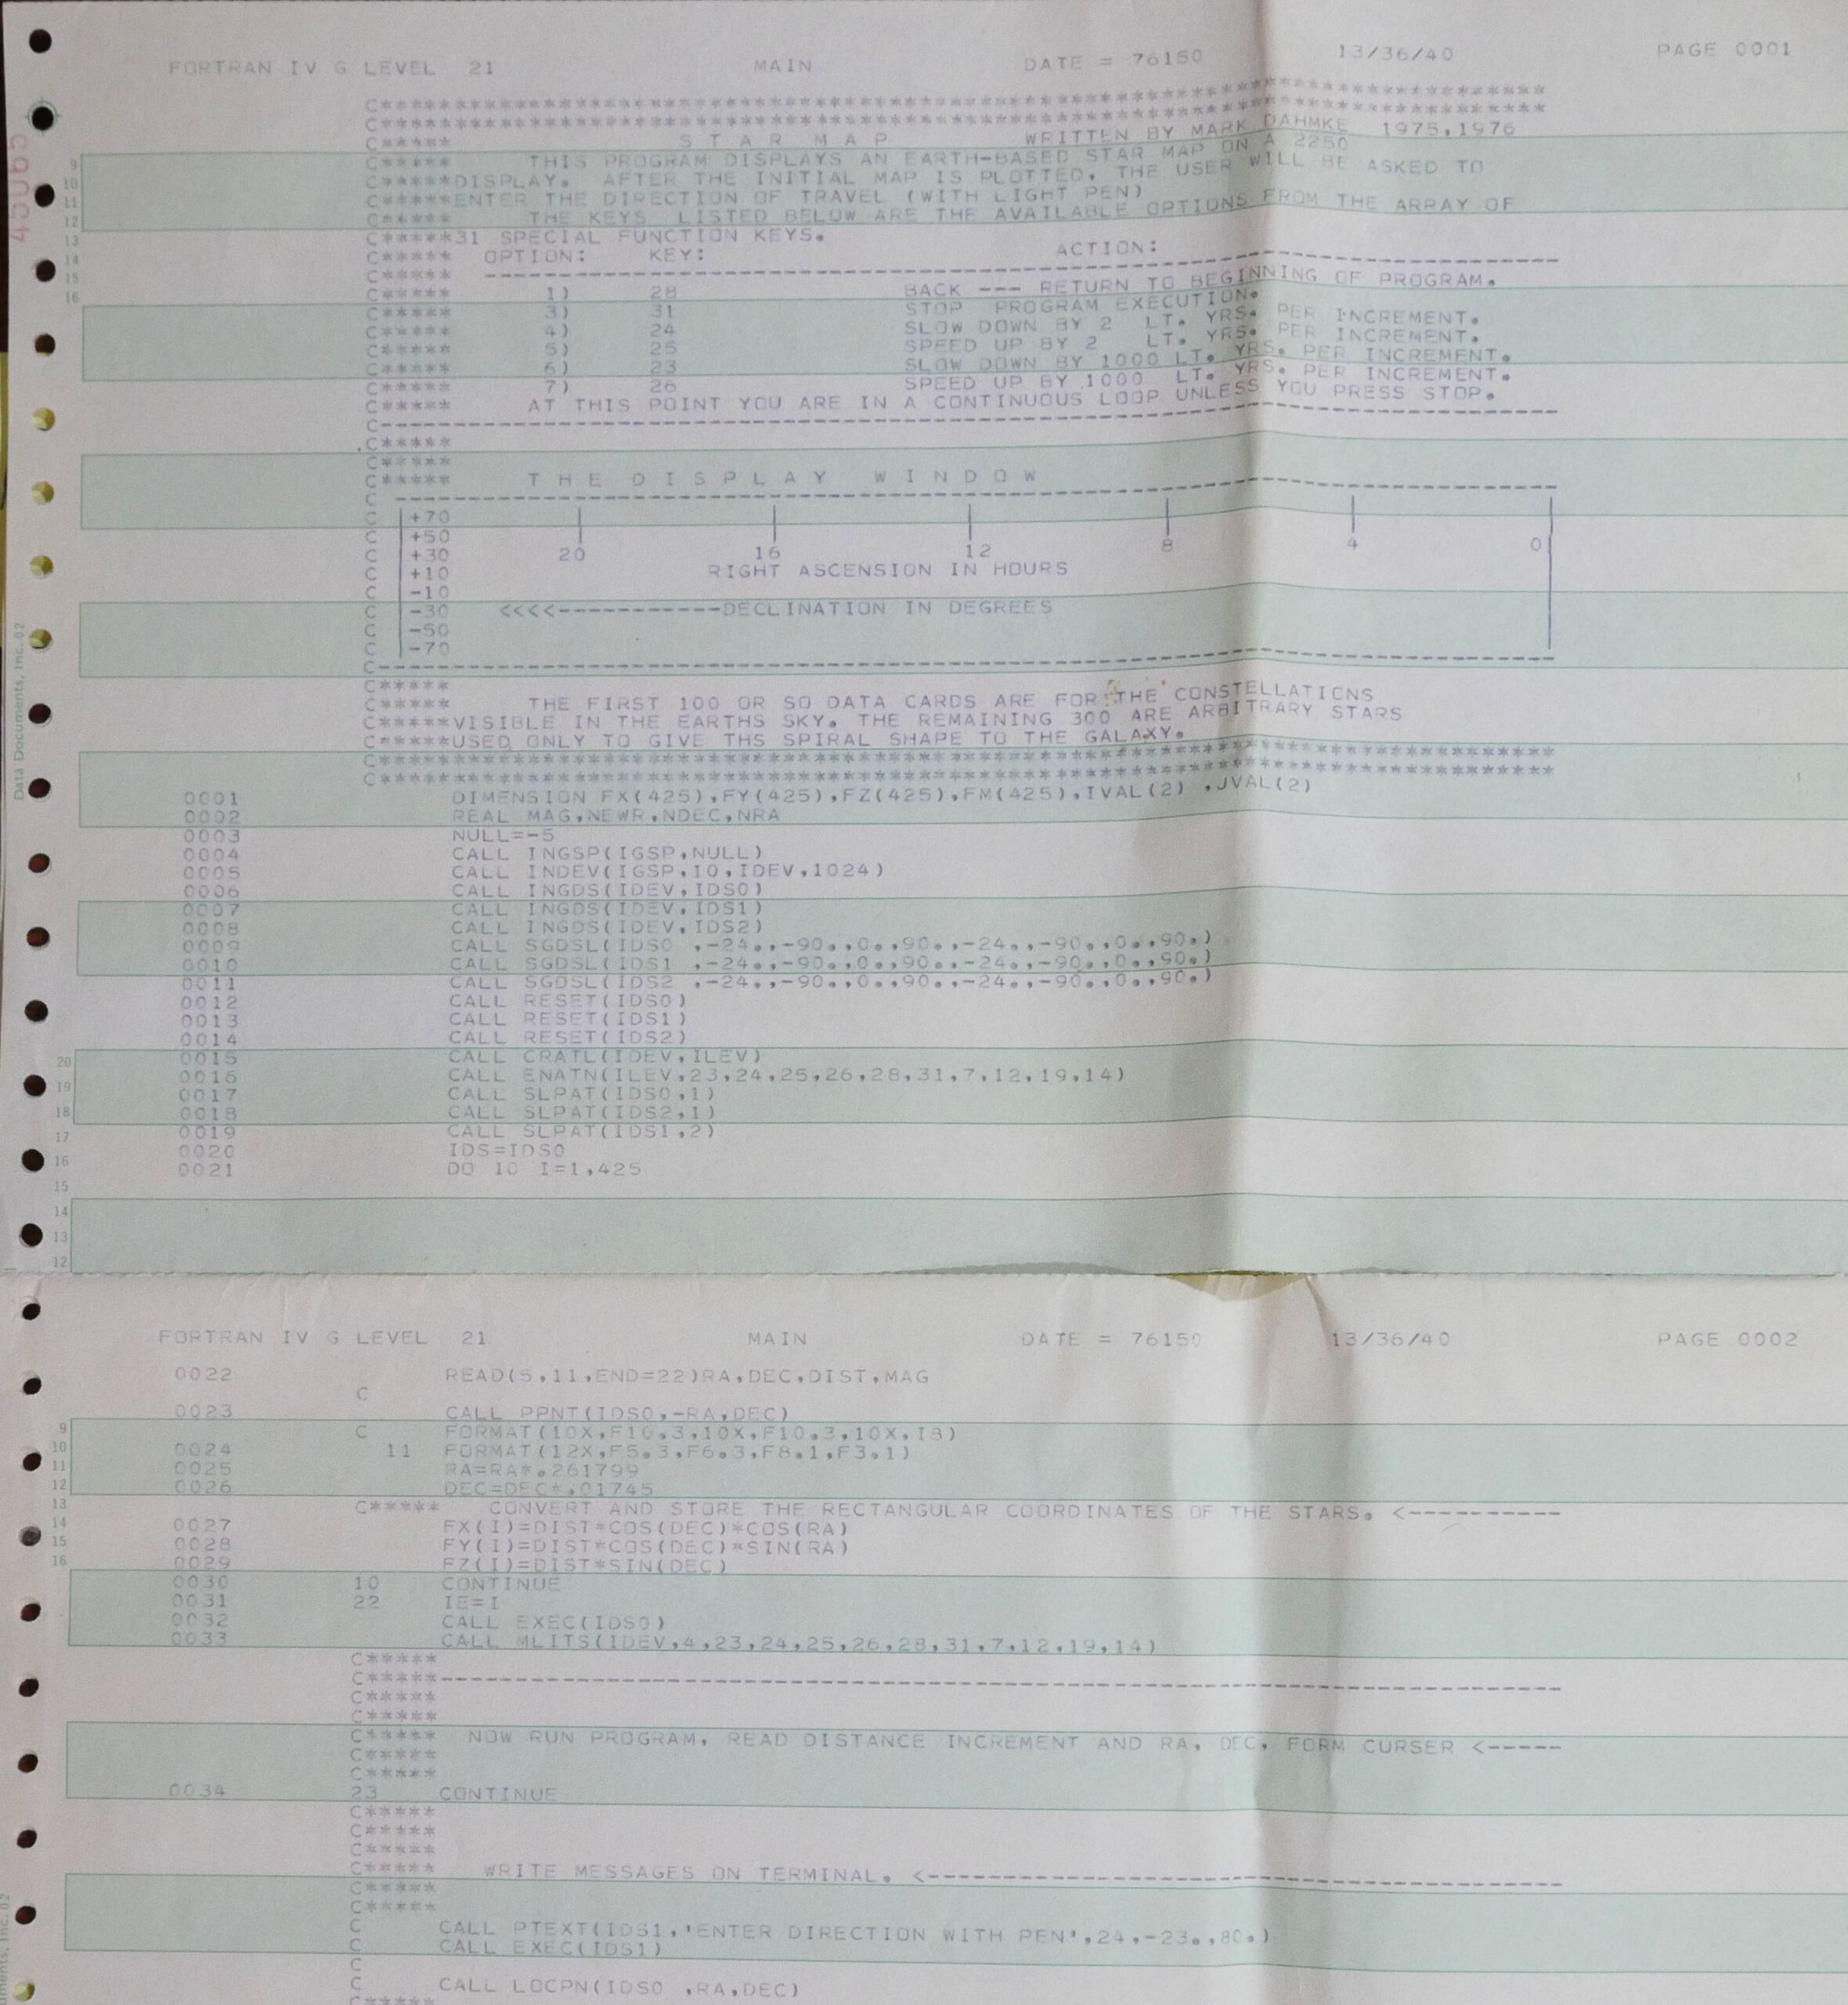
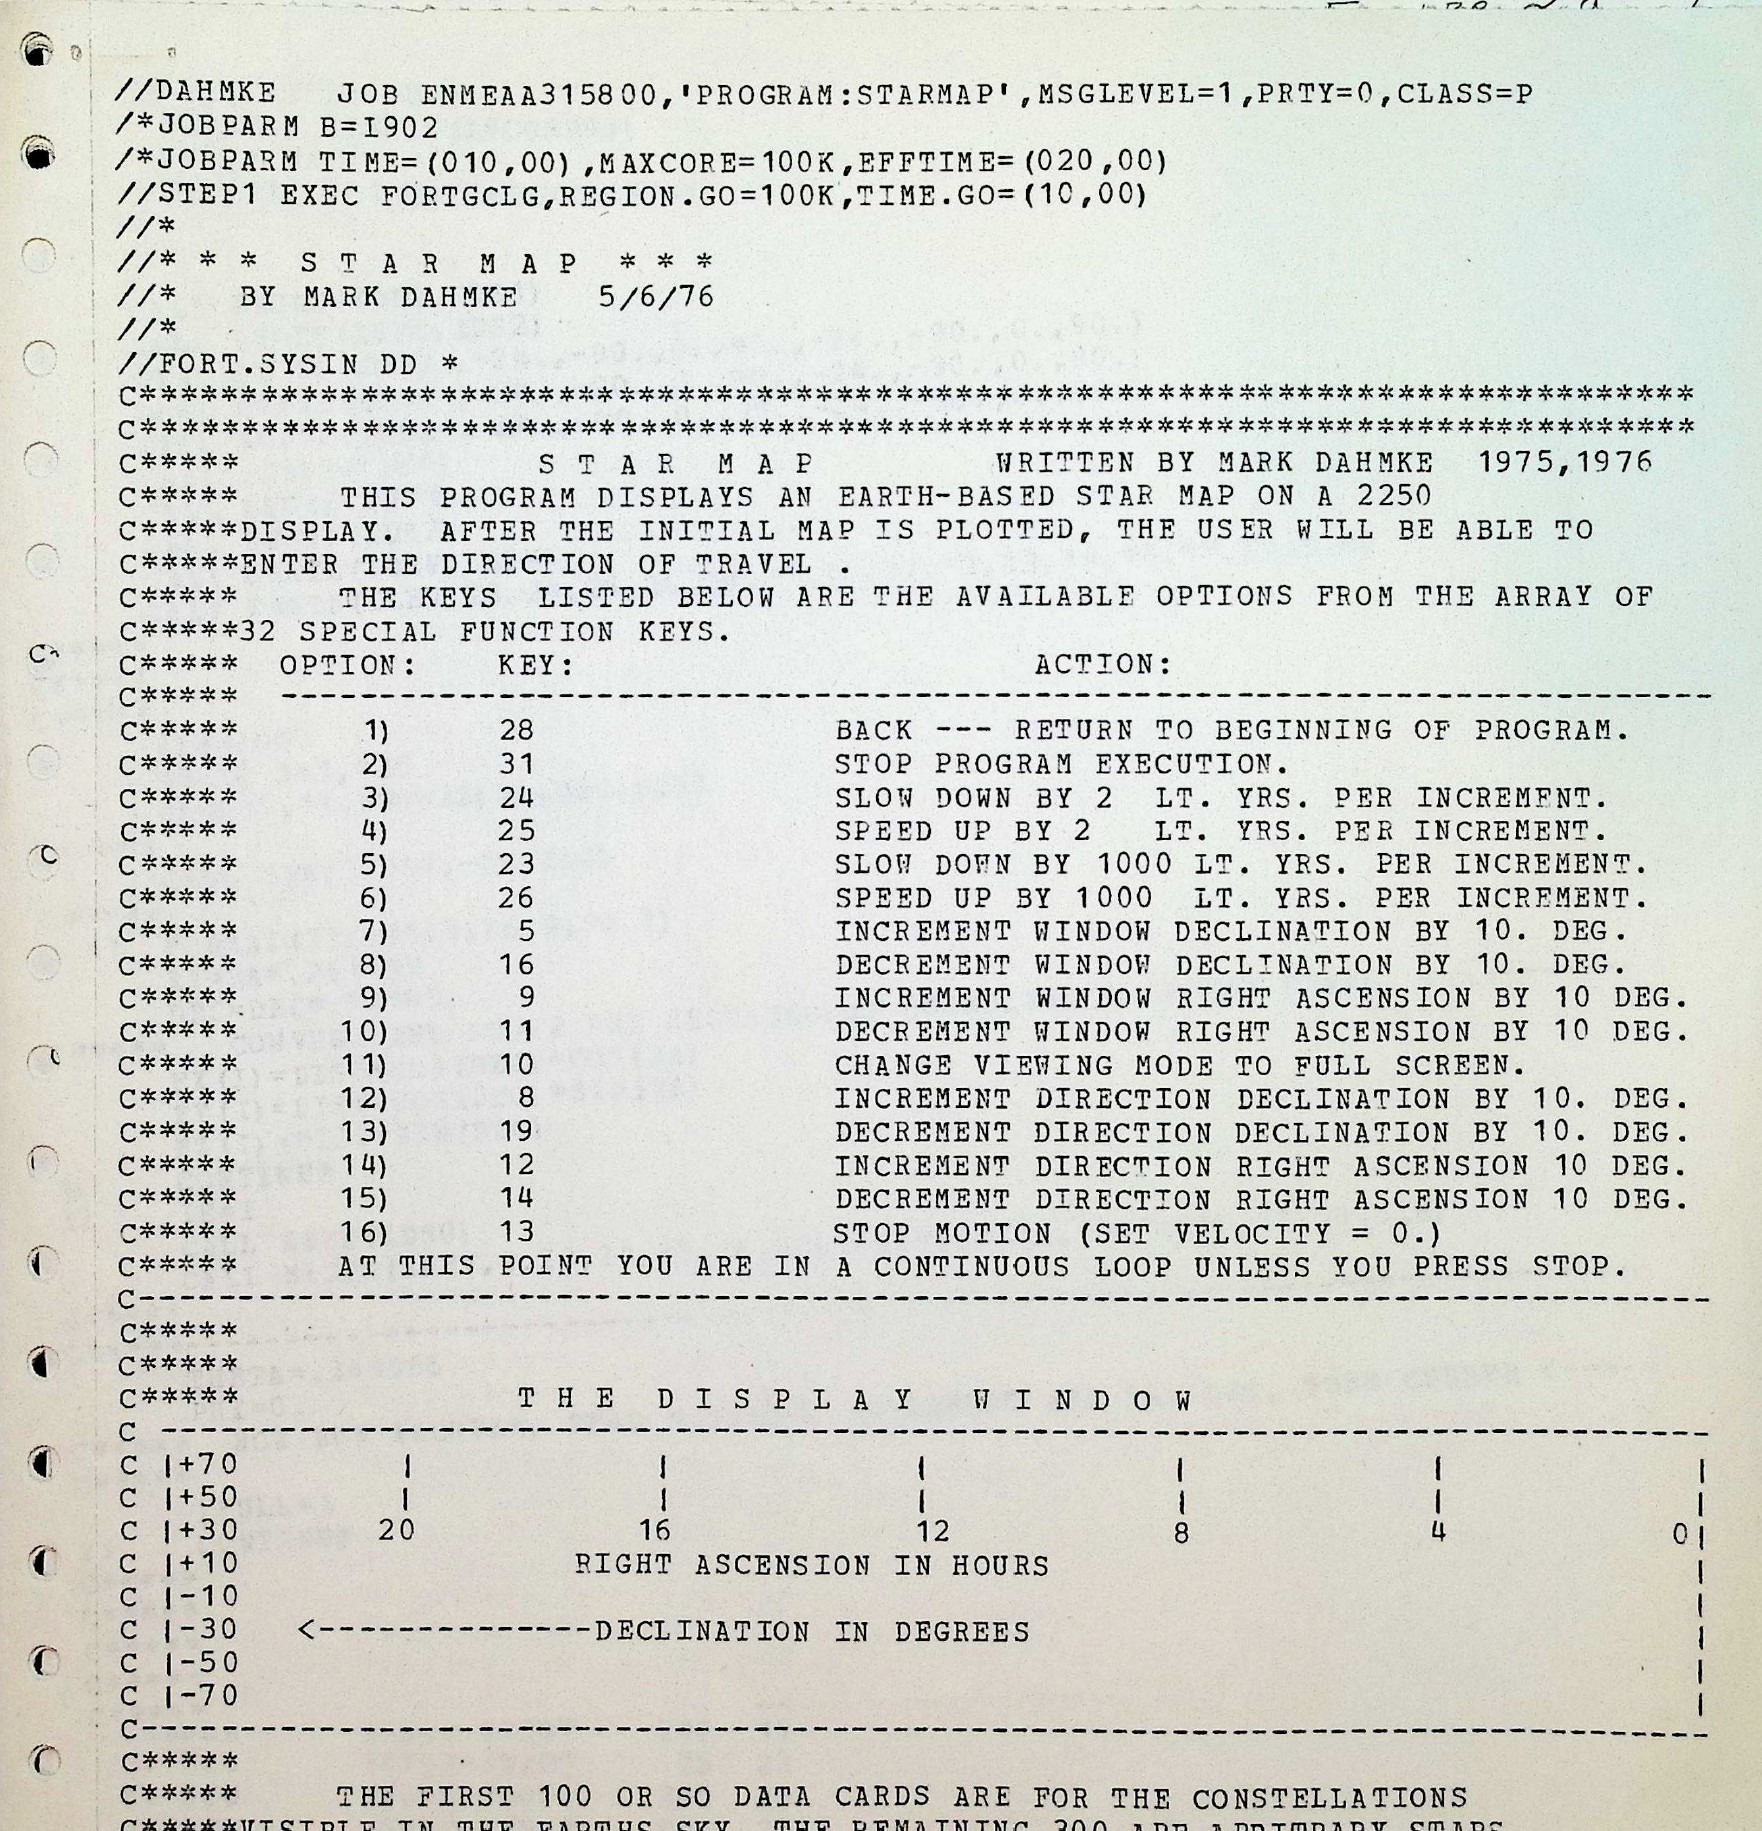
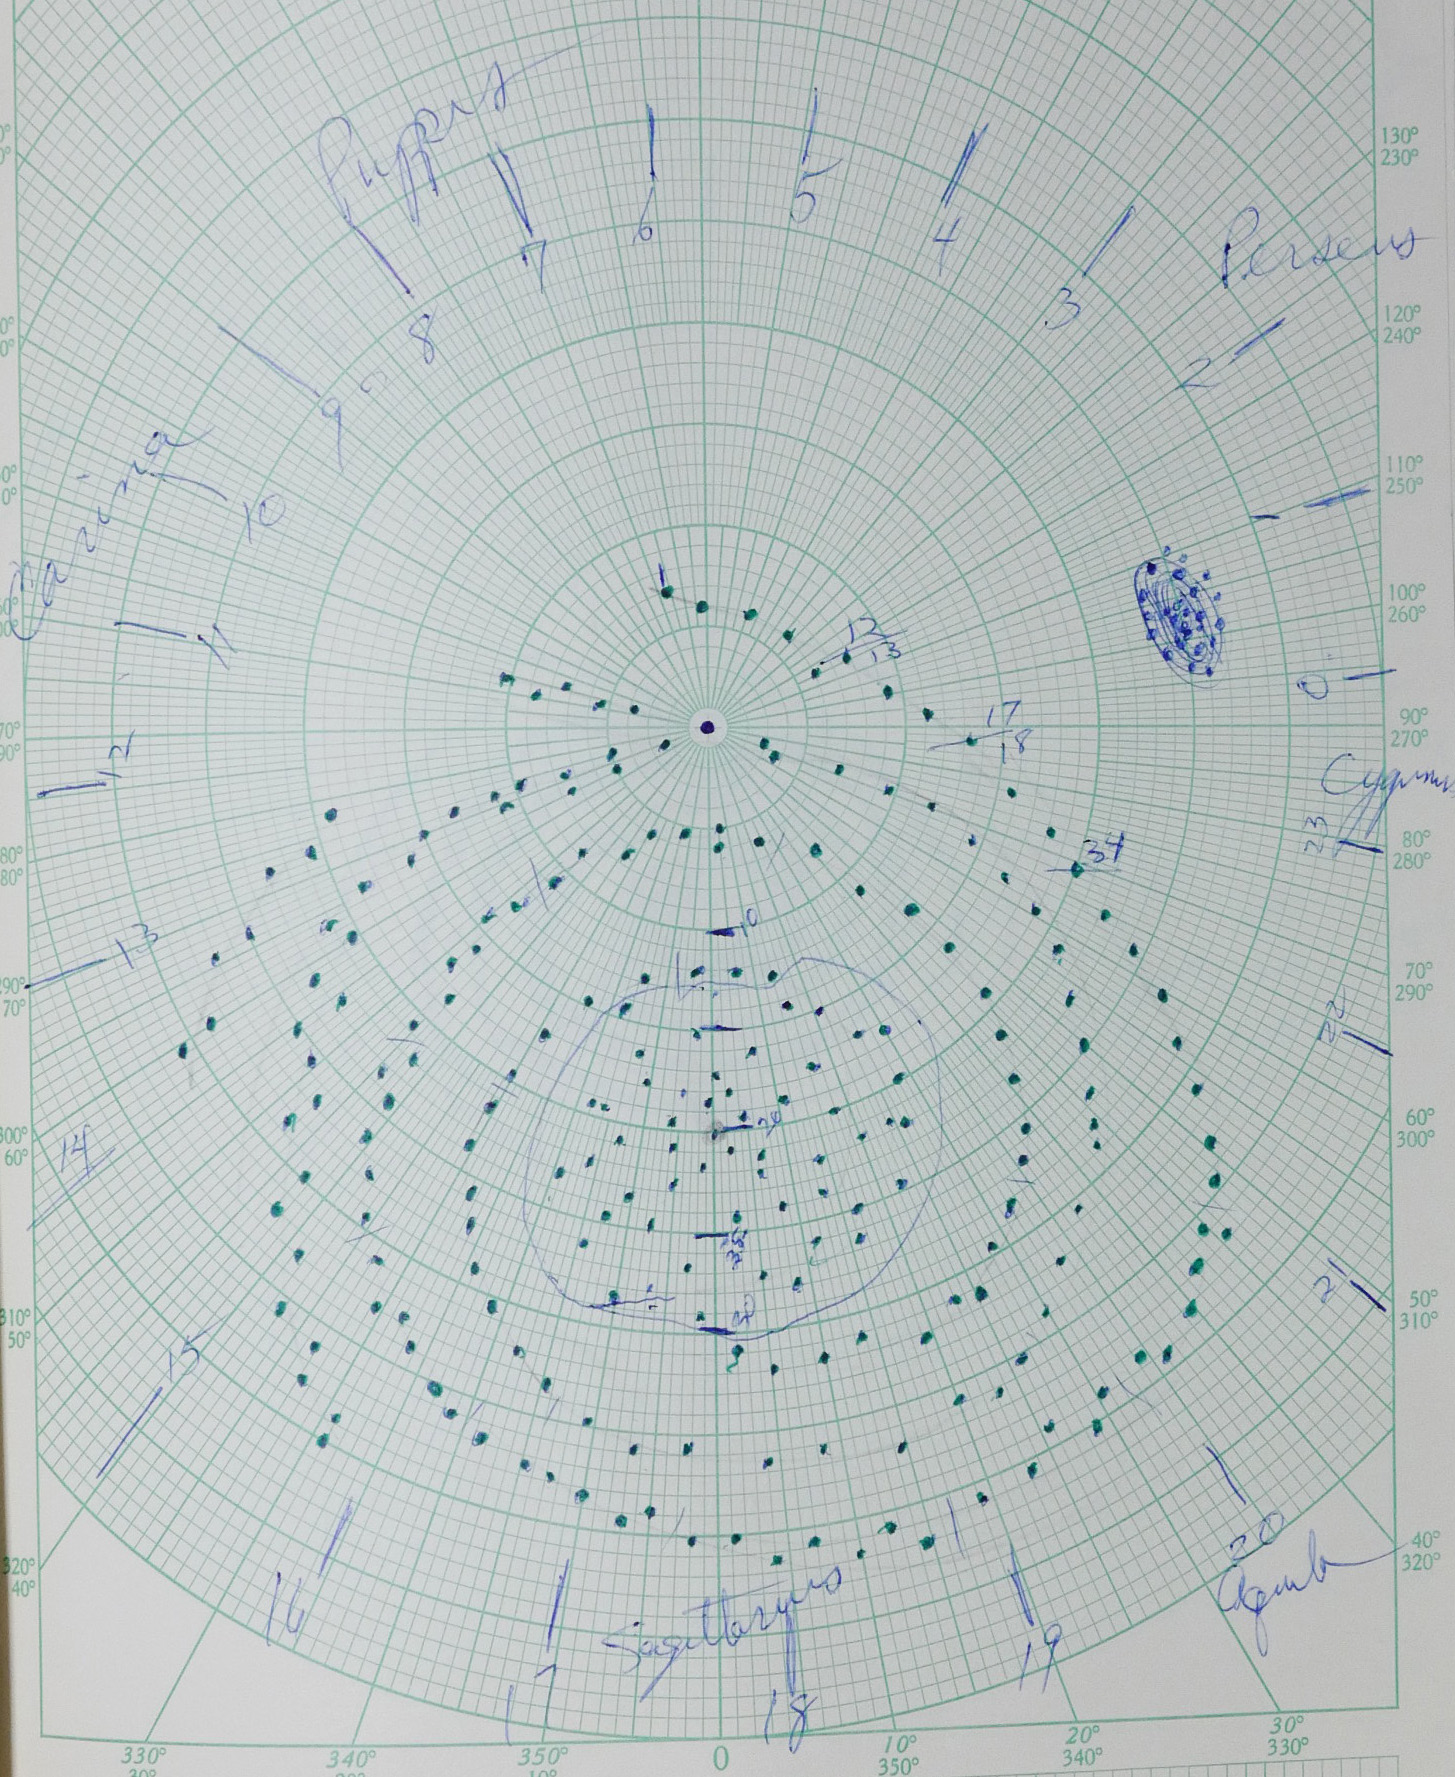
I manually entered (on a keypunch machine) the coordinates for the nearest 100 or so stars with known or approximated distances. To simulate the spiral arms of the galaxy was bit bit more complex. Due to hardware limitations I could only hint at the spiral arms with another couple of hundred points. I used polar coordinate paper and mapped them out relative to the galactic plane, then measured the locations of all the points and added keypunched them. (I still have the punch cards for this dataset.)
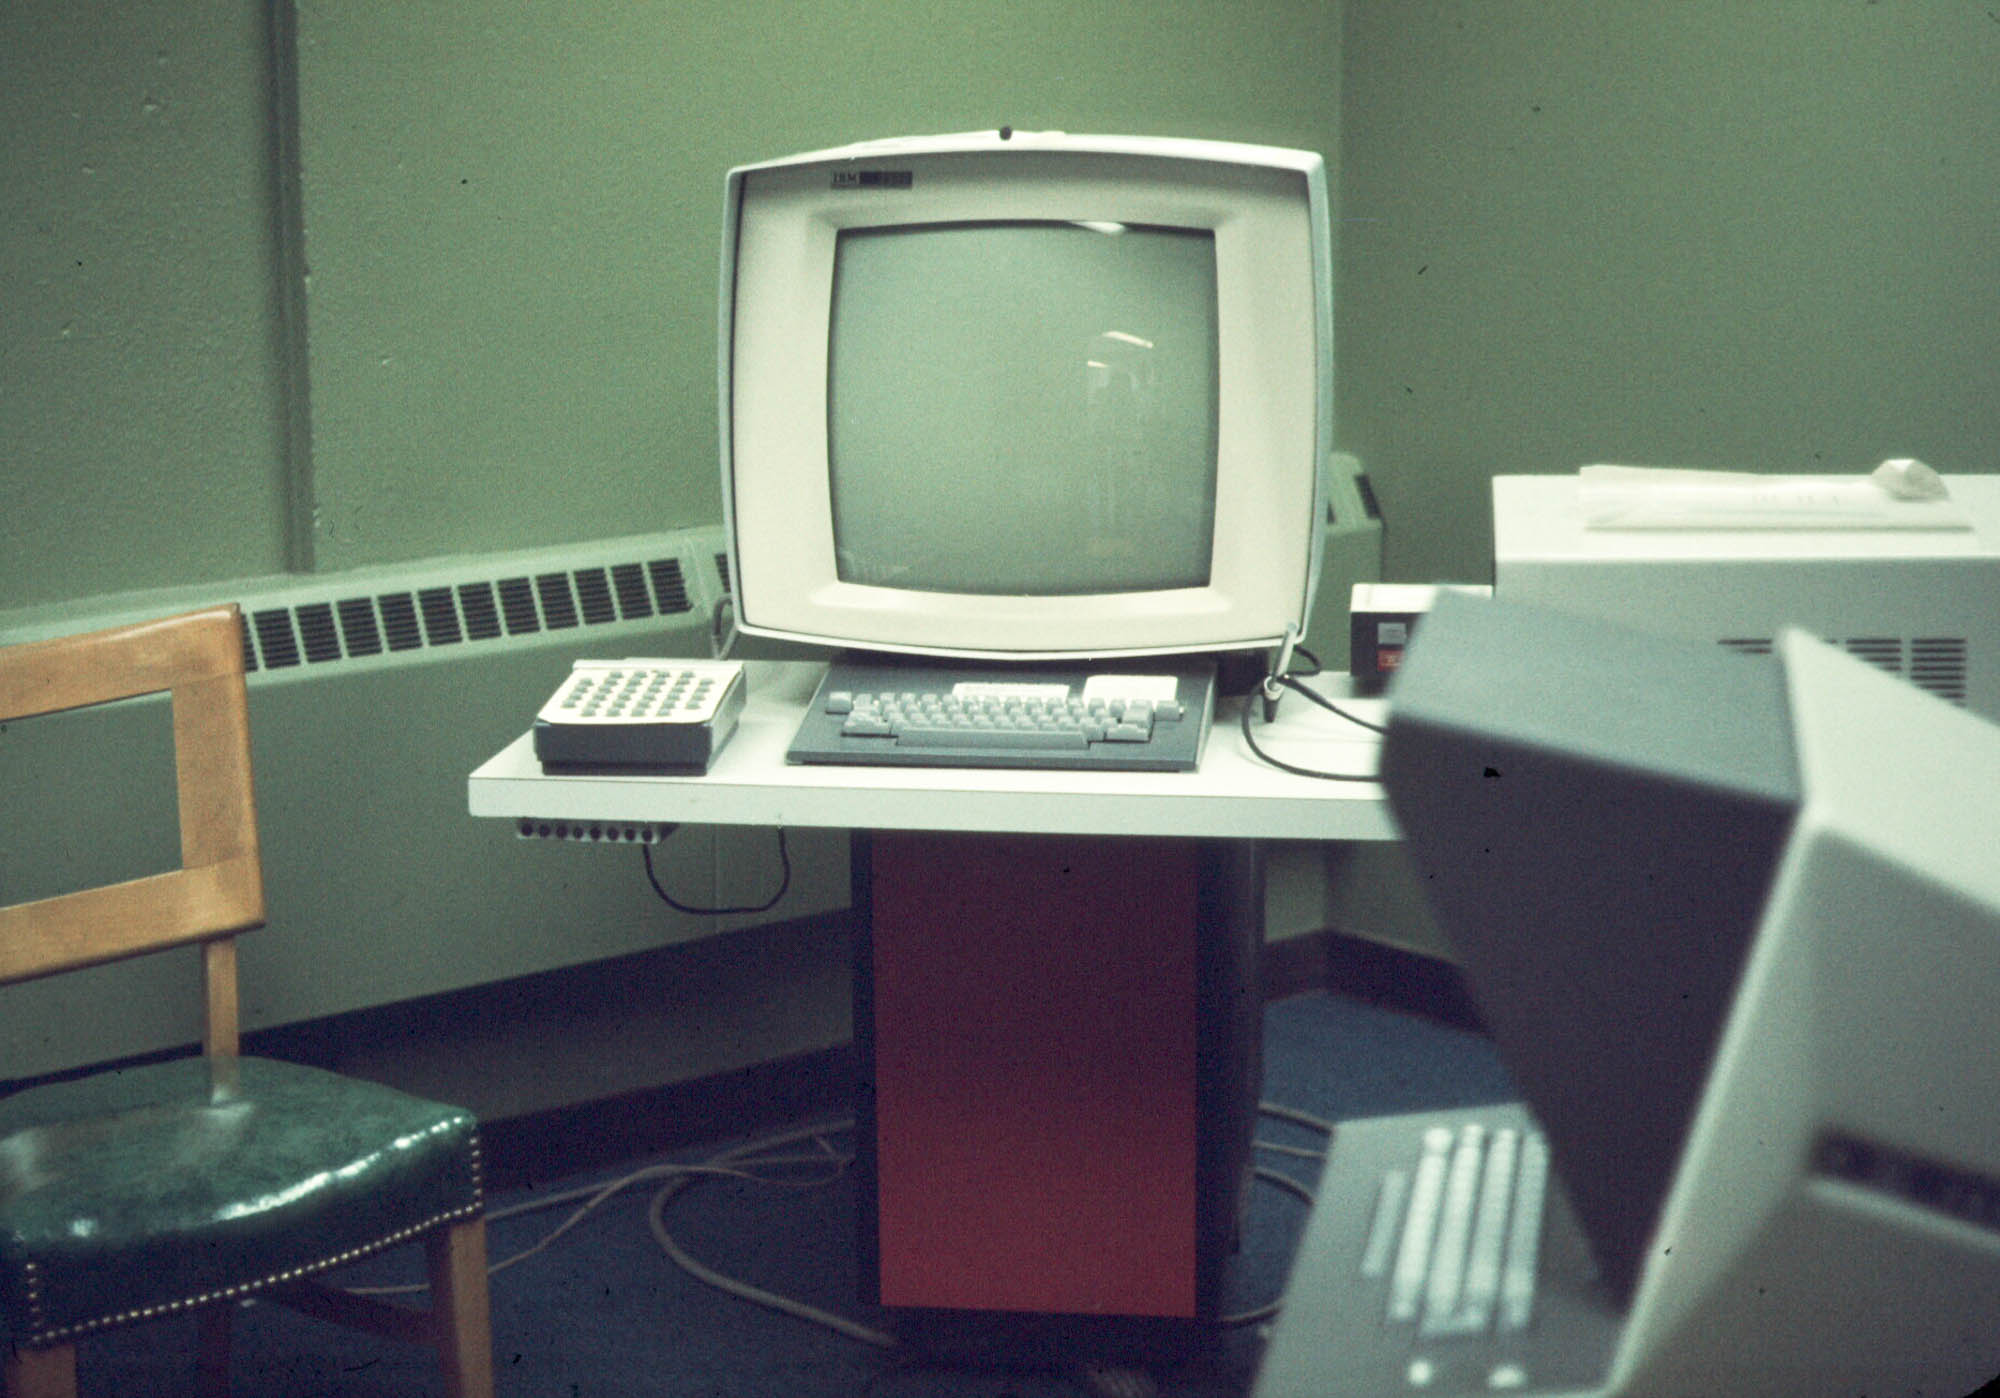
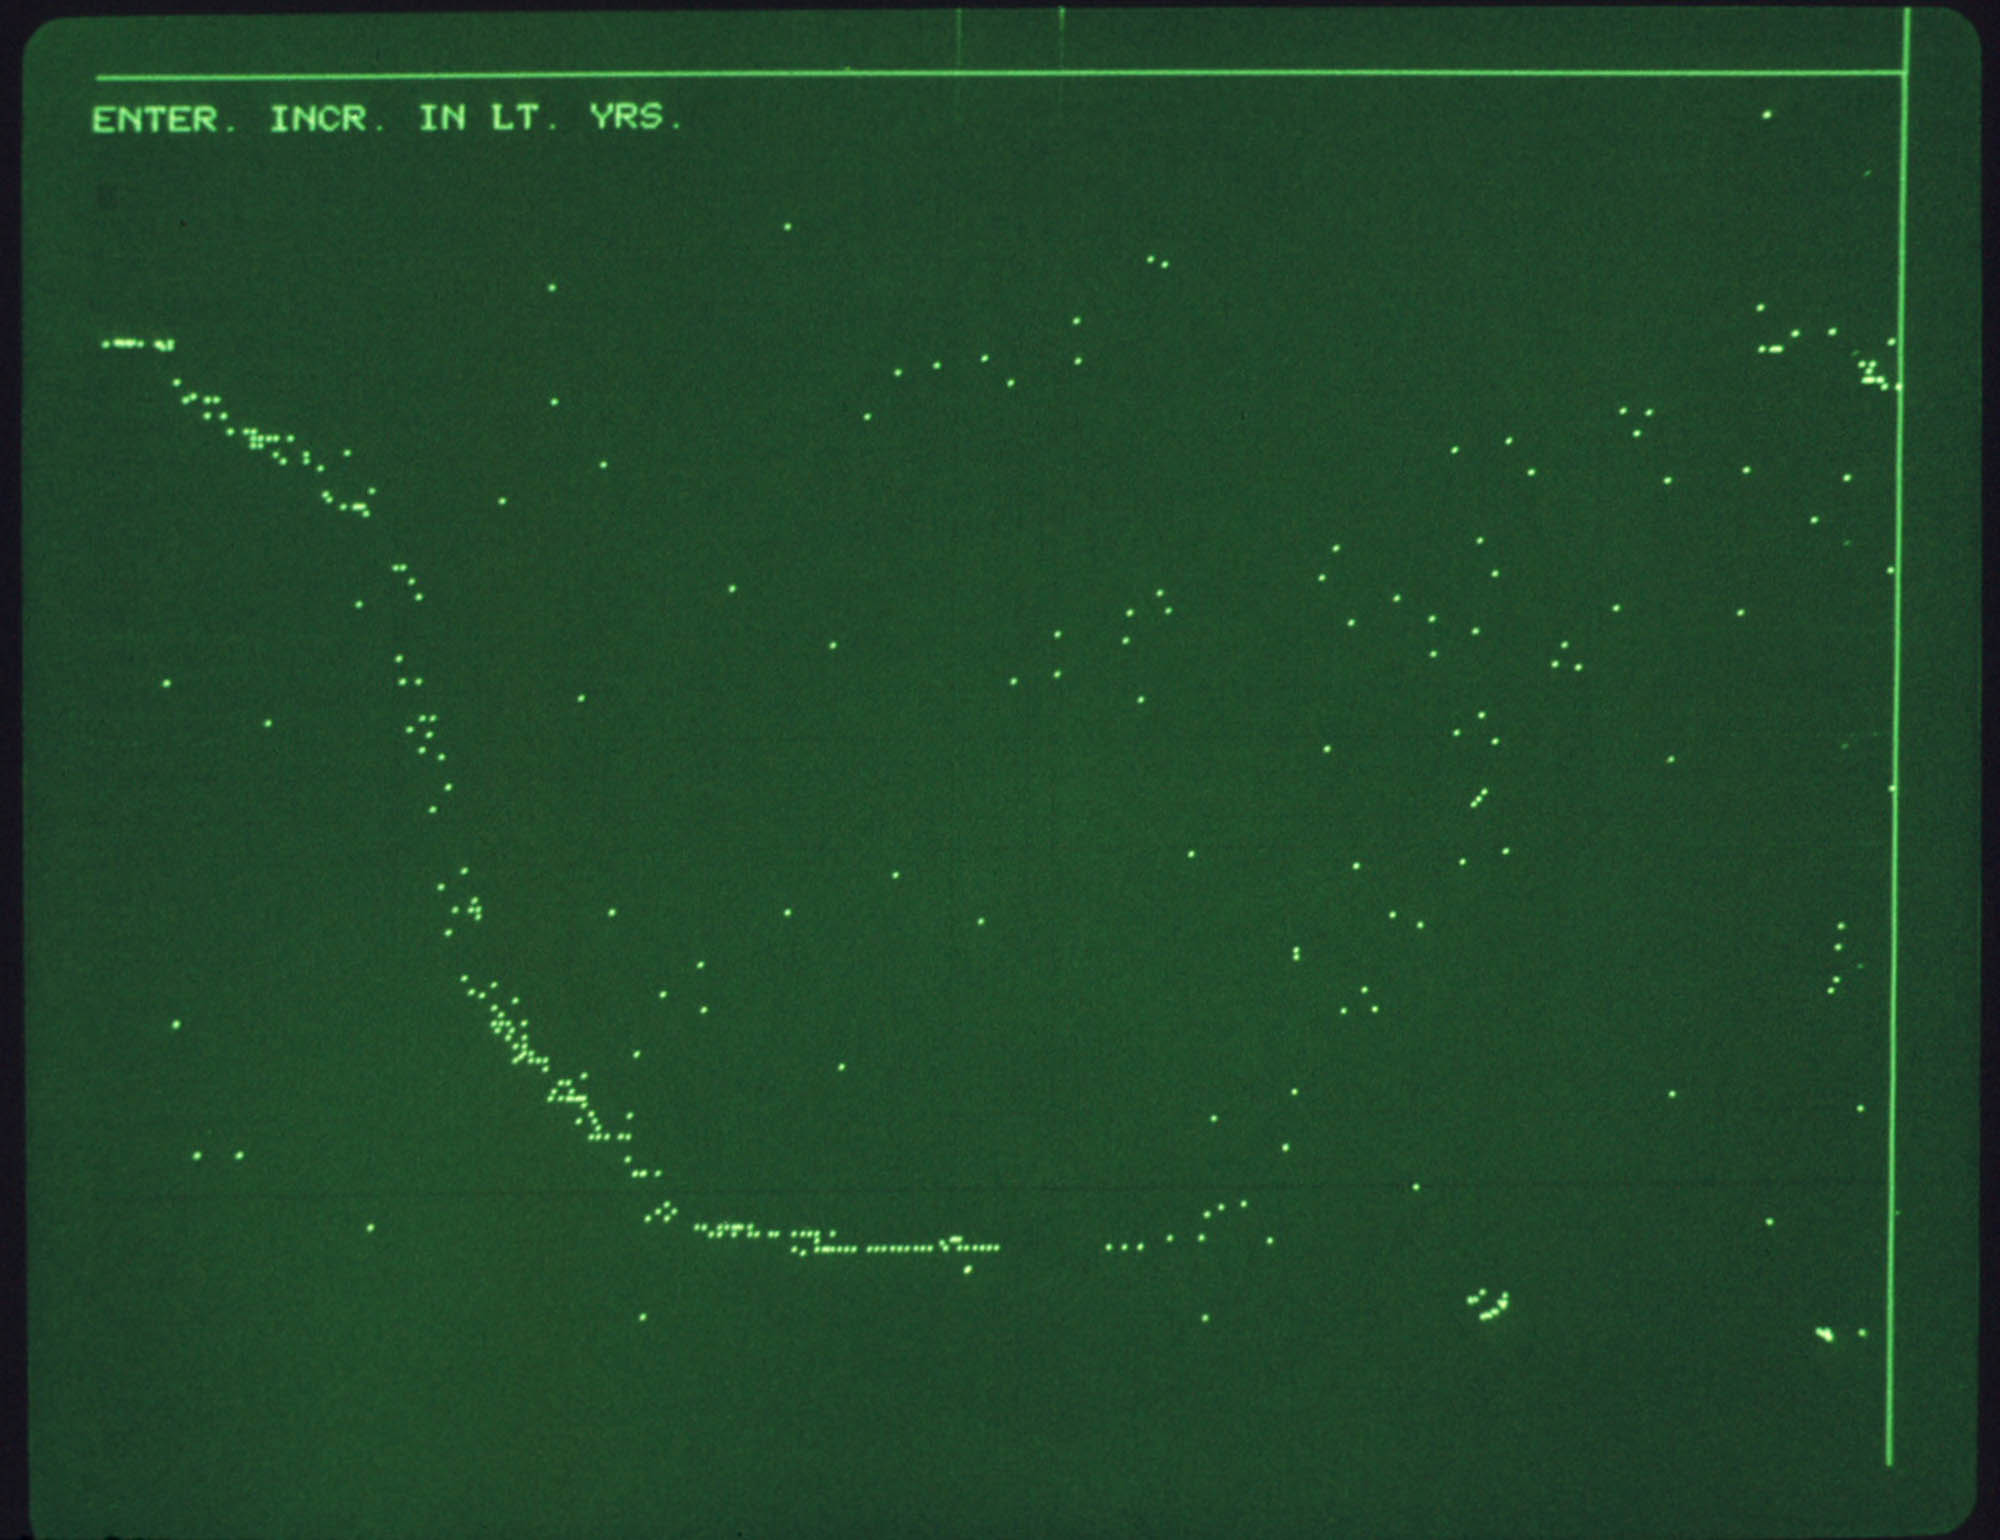
Here’s a photo of the IBM 2250 vector graphics display. In the right foreground is the Tektronix 4013 terminal. On the right is a photo of the program running on the 4013. Starmap ran on the 4013 first but it was not animated.
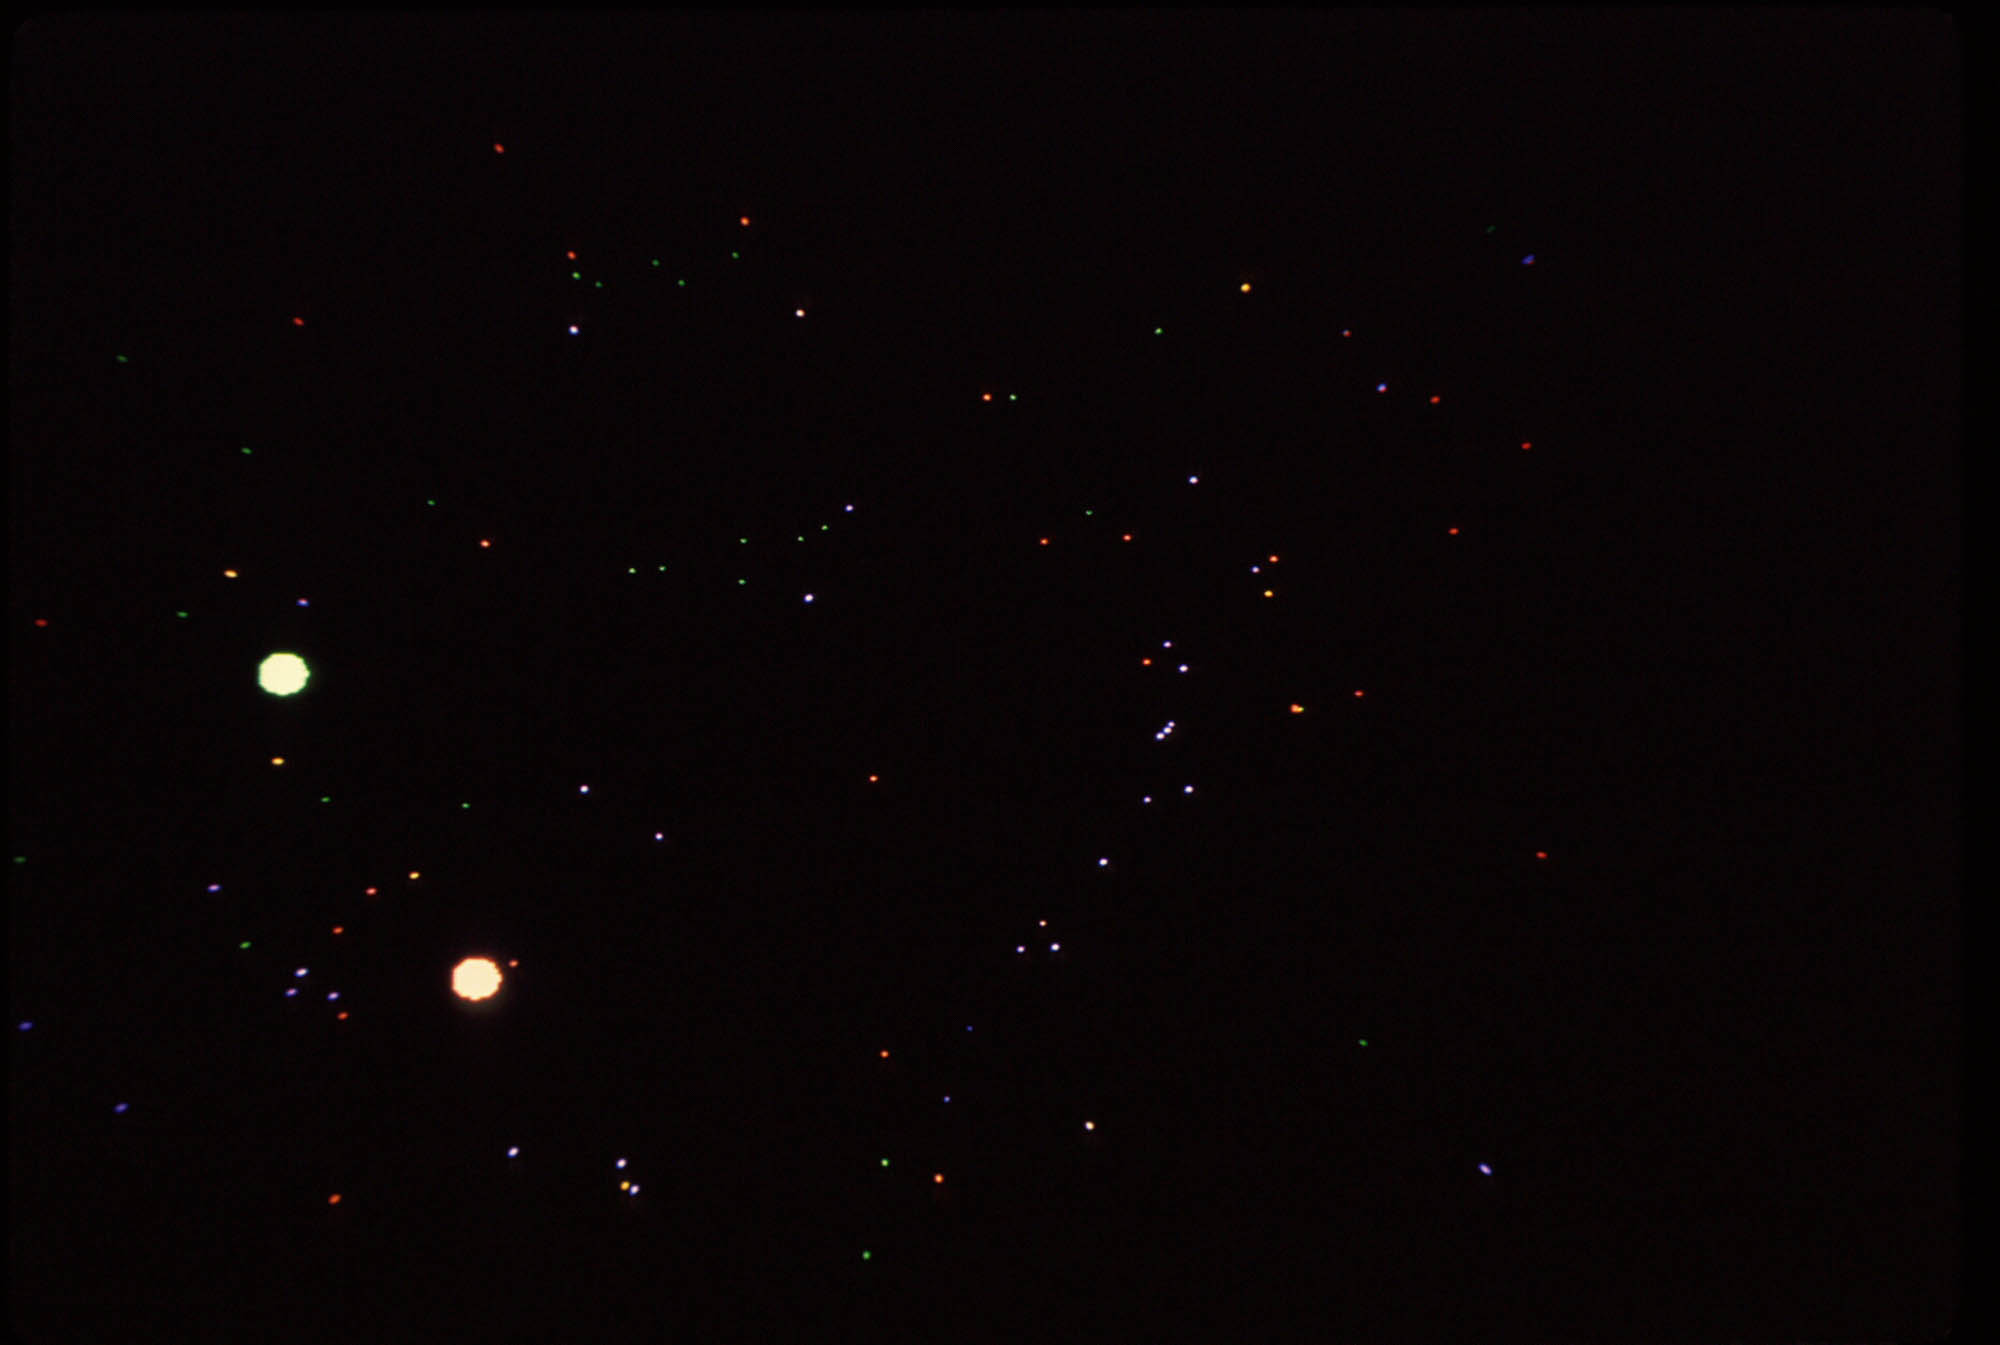
By 1981 I was experimenting with S-100 color graphics cards, so I ported the program to my Z80 homebuilt computer. This version computed the relative magnitude (brightness) of the star and attempted to display it as a single pixel with appropriate color, or if close enough it would draw a filled circle.
Here’s a view of the sky as seen from the vicinity of Sirius A and B. I even modified the program to include Larry Niven’s Ringworld and gave him a copy of the photo. Unfortunately I can’t include it here because I haven’t been able to find the negative.
Early program documentation – noting the date and location “PTCC” Platte Technical Community College.
